- Home
- Posts
- 10 Website Analytics Tools for Making Smarter Decisions (Free & Paid)
10 Website Analytics Tools for Making Smarter Decisions (Free & Paid)
Track Performance, Understand Your Audience, and Grow Your Business
Kawusara Salley
December 08, 2025

There’s a popular saying that goes: You can’t improve what you don’t measure. And if you’ve ever run a website, you know that couldn’t be more true.
Without website analytics, it’s hard to know what’s actually working on your website. Are visitors finding what they need? Are they sticking around and taking action? Or are they bouncing away?
As highlighted in beehiiv’s 2025 Winter Release, it’s more important than ever to understand your visitors' interactions across multiple touchpoints.
By connecting those dots, you can make data-driven decisions to impact the metrics that matter most to you, whether that’s higher search rankings, page views, conversions, or revenue.
In this guide, I’ll break down the best website analytics tools and what each does best, so you can pick the right one for your needs.
Why Trust Me?
I am passionate about researching and writing about tools that help creators and businesses grow. This list is the result of hours spent comparing the features and user feedback of dozens of analytics platforms.
Table of Contents
The Best Website Analytics Tools: An In-Depth Feature Overview
2. Google Analytics – Best for Users Looking for a Completely Free Website Analytics Tool
3. Google Search Console – Best for Website Owners Looking To Track Search Performance
4. MonsterInsights – Best for WordPress Users Who Want a Simple and Robust Analytics Tool
5. Plausible – Best for Website Owners Looking for a Simple, Open-Source Analytics Tool
6. Contentsquare – Best for User Behavior Analysis and Collecting Feedback
7. Matomo – Best for Users Who Want Data Ownership, Privacy, and Advanced Insights
8. Kissmetrics – Best for Tracking Individual Customer Journeys
9. HubSpot – Best for Teams Who Want a Unified Platform for Content Analytics, Marketing, and Sales
10. Adobe Analytics – Best for Enterprise-Level Customer Journey Analysis
What Are Website Analytics Tools?
Website analytics tools are software applications that track and report how people find and interact with your website. They help you see whether you’re attracting the right audience, who your visitors are, and the actions they take on your website.
But not all website analytics tools are created equal. They generally fall into three main categories:

SEO and Content Analytics
These show how your website content attracts and engages visitors, using metrics like search rankings, page views, average time on page, and bounce rates. They help you answer questions such as:
Which keywords are people using to find my website?
What content keeps readers on the page longer?
Which posts are driving conversions?
If you’re a creator or content marketer, these insights help you optimize your content strategy, from choosing the right keywords to updating existing content for better conversions.
User Behavior Analytics
If SEO tools tell you what people are doing on your site, behavior analytics tools show you how they’re doing it.
With tools like heatmaps and session replays, you can watch how visitors move through your site, how far they’re scrolling through your pages, and the stuff they click. These help answer questions like:
Are visitors clicking where I want them to?
What’s causing visitors to drop off?
How do users move through my pages before converting?
For infopreneurs, e-commerce brands, and UX researchers, these are a goldmine for uncovering funnel bottlenecks, refining landing pages, and improving conversion paths.
Customer Journey Analytics
These offer advanced insights into customer journeys across multiple channels, including your website, email campaigns, and social channels. So you get to answer questions like:
How do people move from awareness to purchase?
Where do users drop off before converting?
Which marketing channels drive the highest ROI?
For B2B companies, these insights are helpful for getting a 360-degree view into buyer journeys and improving lead generation and conversion strategies.
The Best Website Analytics Tools: An In-Depth Feature Overview

1. beehiiv – Best All-In-One Platform for Analyzing Audience Insights Across Websites and Newsletters
beehiiv is a newsletter platform for creators and small businesses who want to access everything—newsletter and blog publishing, website builder, and analytics—under one modern and simple dashboard.
Like most website analytics tools, beehiiv lets you track metrics such as unique visitors, page views, and bounce rates over any time period. You can also see your top pages, traffic sources, audience locations, and devices people use to access your site.
I like how beehiiv’s web analytics dashboard only shows you the insights you need and presents them in a neat one-page report with color-coded graphs, tables, and charts.

Besides web analytics, you get separate reports for your newsletter performance:
Subscriber Reports track how your list grows over time and where subscribers come from, whether that’s your website, referrals, ads, or beehiiv’s built-in growth tools.
Posts Reports show key metrics like impressions, open rates, email clicks, and web clicks for your newsletters and blog posts.

A key feature that stood out to me is how beehiiv’s Subscriber Reports let you define your top acquisition sources. You can set these based on:
The number of subscribers each source brings in
Engagement levels, including open, click, and referral rates
Conversion rates, which is the percentage of subscribers who join your paid newsletter
So instead of only focusing on the channel that brings in the most subscribers, it also draws your attention to a smaller channel that might be driving the majority of your paid conversions.
This way, you get a better overview of channels to focus on when designing your future growth strategies.
beehiiv Pros
Filter analytics by time period, channel, and UTM campaign
Export analytics as a CSV file for deeper analysis
Integrate beehiiv with Google Search Console for SEO insights
beehiiv Cons
Advanced analytics aren’t available on the free plan
beehiiv Pricing
The free plan lets you create a website, connect a custom domain, publish unlimited newsletters and blog posts, access basic analytics, and grow your list to 2,500 subscribers. Paid plans start at $49/month for 1,000 subscribers and include advanced analytics.
2. Google Analytics – Best for Users Looking for a Completely Free Website Analytics Tool

Launched in 2005, Google Analytics (GA) quickly became the go-to website analytics software for businesses of all sizes. It helps to track site performance through metrics like page views, bounce rates, and conversions.
A few years ago, Google switched from GA3 to GA4, which uses an event-based tracking model. Instead of displaying standard metrics by default, GA4 logs all user interactions as events. This gives you more detailed insights but can feel complex and confusing to regular website owners.
On the plus side, GA4 introduced a privacy-first approach to data tracking and also made it easy to map a user’s journey across your websites and mobile apps in one place.
Google Analytics Pros
Create custom reports to track user engagement, conversions, and revenue
Manage analytics for multiple websites and apps in one account
Extensive free tutorials to learn the platform
Google Analytics Cons
Steep learning curve for new users
No dedicated customer support
Google Analytics Pricing
Google Analytics is free, but larger organizations can upgrade to Analytics 360 for more advanced customization and enterprise-level support.
3. Google Search Console – Best for Website Owners Looking To Track Search Performance

While Google Analytics tells you that some visitors came from search, Google Search Console (GSC) shows how they got there.
With GSC, you can track metrics like impressions, click-through rates, and average position for each of your web pages in Google Search. You can also see which keywords people use to find your site, along with your top-performing and underperforming pages based on total clicks and impressions.
These insights help you decide which high-ranking pages to update to maintain performance and which low-performing ones to improve for better rankings.
Google Search Console Pros
Simple interface and performance reports
Monthly performance reports via email
Alerts for indexing issues and fix them in a few clicks
Google Search Console Cons
Doesn’t track data from other search engines like Yahoo! and Bing
SEO data is basic compared to premium SEO tools
Google Search Console Pricing
It’s free.
4. MonsterInsights – Best for WordPress Users Who Want a Simple and Robust Analytics Tool

MonsterInsights is a WordPress plugin that makes Google Analytics simple for everyday users.
It pulls key website metrics—like page views, session duration, and bounce rates—from Google Analytics and displays them in an easy-to-read format right inside your WordPress dashboard.
I like that you can set up extra tracking without touching any code. Bloggers can track affiliate link clicks, file downloads, and form submissions, while infopreneurs and eCommerce owners can integrate with plugins like WooCommerce and MemberPress to monitor conversions, sales, and best-selling products.
MonsterInsights Pros
Access a support team to troubleshoot issues
Track on-page video performance with metrics like views, watch time, and average view duration
Connect with GSC to show search insights in your dashboard
MonsterInsights Cons
Only runs on WordPress websites
Pricing is billed annually
MonsterInsights Pricing
MonsterInsights offers a free version for one website with basic audience insights. Paid plans start at $199/year, unlocking detailed reports and support for multiple sites.
5. Plausible – Best for Website Owners Looking for a Simple, Open-Source Analytics Tool

Plausible is a simple website analytics platform that tracks key metrics like page views, traffic sources, and conversions. Its dashboard is easy to read and doesn’t require digging through layers of reports.
Unlike most analytics tools, Plausible is open-source, cookie-free, and fully GDPR, CCPA, and PECR compliant. This makes it ideal for businesses that care about data privacy and ownership.
Plausible has a WordPress plugin that lets you see your stats directly in your dashboard. It also includes built-in tracking for WooCommerce and Easy Digital Downloads, so you can track conversions, best-sellers, and how visitors move through your store from browsing to purchase.
Plausible Pros
Share analytics with team members using a custom link
Send automated weekly or monthly reports by email
Import GA data and integrate with GSC
Plausible Cons
The hosted version has no free plan
Advanced users may find its insights limiting
Plausible Pricing
Plausible’s open-source version is free but requires technical setup and your own server. The hosted version includes a 30-day free trial, with plans starting at $9/month for one site, 10K monthly page views, and three years of data retention.
6. Contentsquare – Best for User Behavior Analysis and Collecting Feedback

Contentsquare combines content and user behavior analytics into one, so you can see exactly what’s working on a page and what’s causing users to leave.
It includes heatmaps and session replays that show where visitors click, scroll, or get stuck. This helps you spot usability issues, fix bugs, and make design changes that improve engagement and conversions.
While Contentsquare’s interface is easy to navigate, its comprehensive feature set raises the learning curve.
Contentsquare Pros
Collect user feedback with surveys and polls from your website
Track user journeys with visual funnels and see conversions at each step
Integrate with GA for comprehensive insights in one dashboard
Contentsquare Cons
Pricing is based on monthly sessions, which can be costly for high-traffic sites
User journey analysis is limited to higher-tier plans
Contentsquare Pricing
Contentsquare’s free plan includes 20K monthly sessions, unlimited heatmaps, and 5K session replays. The Growth Plan starts at $49/month for 7K sessions, while Pro and Enterprise plans require a custom quote.
7. Matomo – Best for Users Who Want Data Ownership, Privacy, and Advanced Insights

Matomo combines the best of multiple worlds into one. It tracks the basic metrics you’d expect from Google Analytics, like page views and bounce rates, along with features such as heatmaps, session replays, and funnels that you’d find in Contentsquare.
Like Plausible, Matomo provides both open-source and cloud-hosted options, complies with GDPR and CCPA, integrates with GA and GSC, and includes a WordPress plugin.
However, the interface looks a bit dated, and with so many features, it can feel overwhelming when you first start using it.
Matomo Pros
Run A/B tests on your pages to improve conversions
Track conversion goals like page visits, link clicks, and file downloads
Integrates with 100+ apps, including WordPress, WooCommerce, Squarespace, and Shopify
Matomo Cons
Takes time to learn all its features
Support is available only via email
Matomo Pricing
Matomo’s open-source version is free to download and self-host. The hosted version has no free plan. Pricing starts at €22/month (about $26/month) for 50,000 hits, while the Enterprise plan is custom-quoted.
8. Kissmetrics – Best for Tracking Individual Customer Journeys
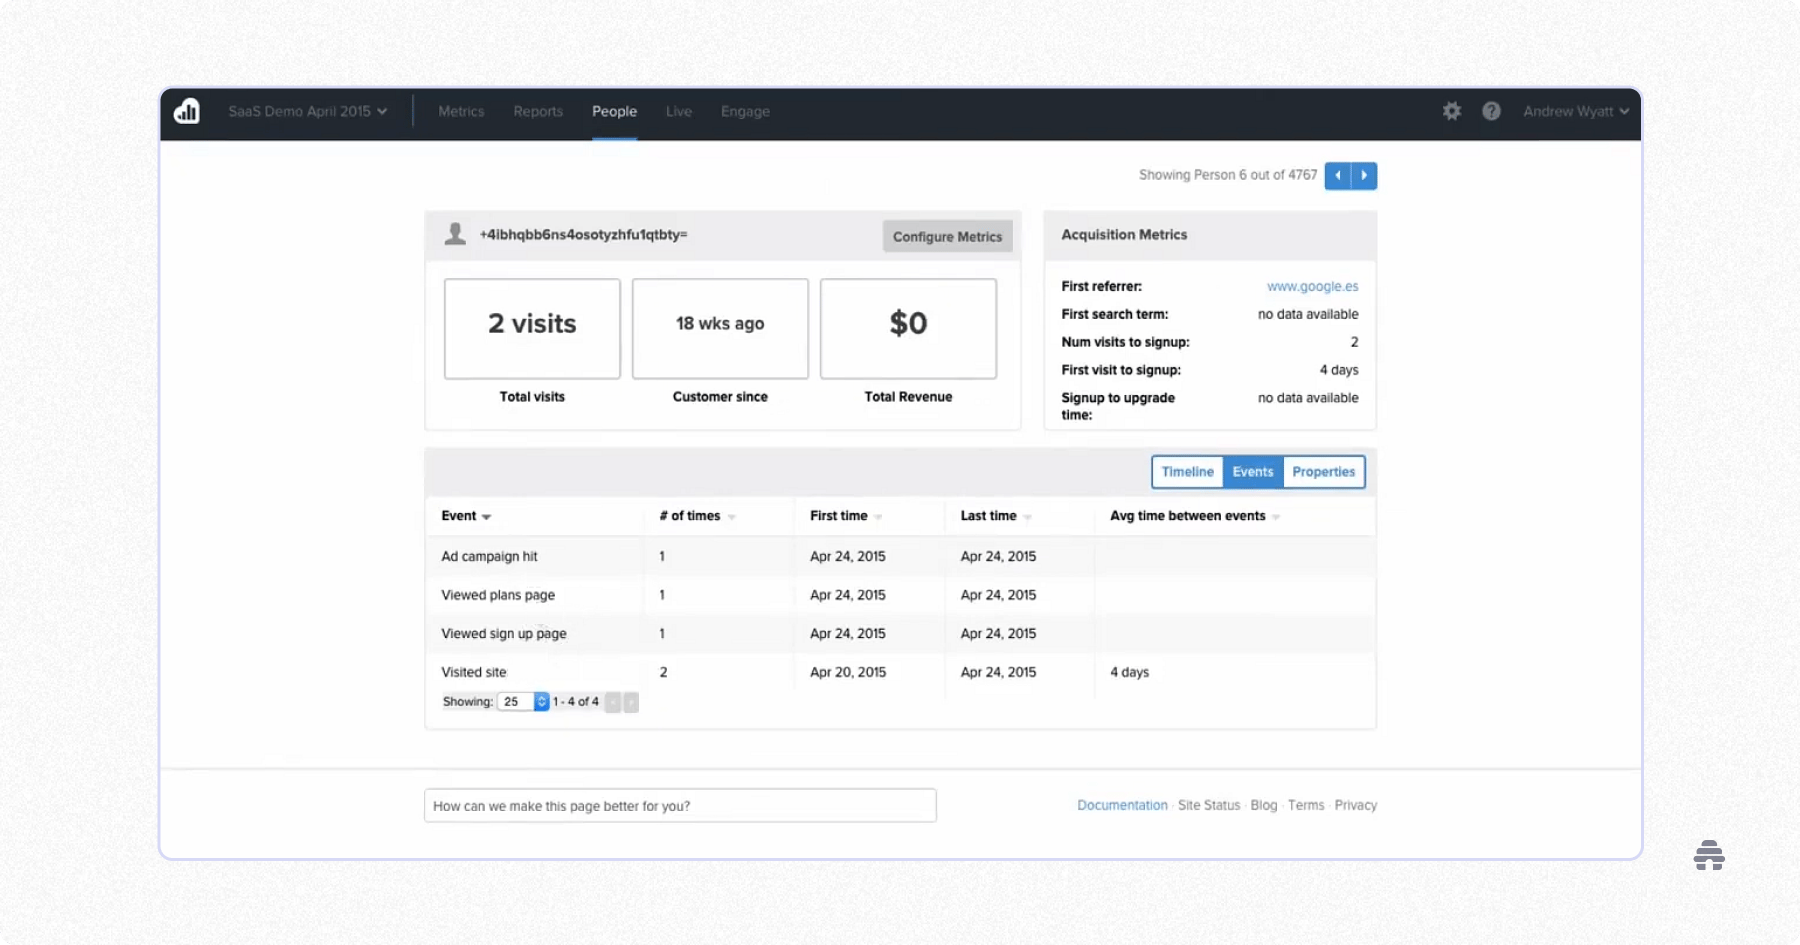
Kissmetrics provides deep insights into each user’s journeys across multiple devices and channels.
Unlike most website analytics software, Kissmetrics creates a unique profile for every visitor, showing a timeline of their interactions—the pages they’ve viewed, the campaigns they’ve engaged with, and the plans they’ve signed up for.
You can also segment users, track their behavior over time, and set up automated emails based on specific actions or events.
While the interface feels intuitive, it’s complex to set up and learn all its features. But for SaaS or ecommerce brands, the investment pays off in higher conversions and revenue.
Kissmetrics Pros
Monitor metrics like visits, signups, and average revenue per user
Use funnel reports to track drop-offs and conversion rates
Identify top-performing campaigns, channels, and products
Kissmetrics Cons
Lacks basic insights like page views and bounce rates
Some advanced reports are only accessible on higher plans
Kissmetrics Pricing
Kissmetrics doesn’t offer a free plan. Paid plans start at $25.99/month for small teams (up to 10K monthly events) and $299/month for medium teams (up to 2M monthly events).
9. HubSpot – Best for Teams Who Want a Unified Platform for Content Analytics, Marketing, and Sales

At its core, HubSpot is a free CRM platform. Over time, it has grown into a unified system with Marketing, Sales, Content, and Service Hubs that streamline workflows across the organization.
The Content Hub includes tools for building websites, landing pages, and blog posts, along with an analytics dashboard that tracks how users interact with your content.
Its color-coded visuals make insights easy to understand, and because everything connects within one platform, you can clearly see how marketing efforts drive leads and conversions.
HubSpot Pros
Follow a customer’s full journey from first visit to purchase
Run A/B tests to identify which page variations convert best
Track form performance through metrics like views, submissions, and conversions
HubSpot Cons
Takes time to understand how the different Hubs work together
Plans can be expensive for small businesses
HubSpot Pricing
The analytics feature is part of HubSpot’s Content Hub, which has a limited free plan. Paid plans with full analytics and A/B testing start at $500/month for small businesses and $1,500/month for enterprises. Other Hubs are billed separately.
10. Adobe Analytics – Best for Enterprise-Level Customer Journey Analysis

Adobe Analytics is an advanced analytics platform built for product, marketing, and UX teams that need detailed, cross-channel data to improve customer experiences and drive growth.
The platform includes four modules:
Customer Journey Analytics: tracks customer interactions across all channels, from acquisition to retention
Web and Mobile Analytics: monitors traffic, conversions, and user paths across your websites and apps
Content Analytics: highlights which web pages, emails, and ads generate the most engagement and conversions
Product Analytics: measures feature usage, friction points, and retention to support product improvement
Each module uses AI-powered models to detect unusual trends, predict user behavior, and surface optimization opportunities.
Adobe Analytics Pros
Create user cohorts and analyze behavior across channels and products
Generate detailed reports with extensive filtering options
Integrates with other Adobe tools like Target and Journey Optimizer
Adobe Analytics Cons
Complex setup and steep learning curve
Very expensive for small businesses
Adobe Analytics Pricing
Adobe Analytics has no free plan and pricing isn’t publicly available. Costs are available through custom quotes, which vary by data volume and business, typically starting around $20,000/year for small businesses and exceeding $100,000/year for enterprise teams.
What Is the Best Website Analytics Tool for You?
The best website analytics software depends on what you need.
If you want something simple for measuring website and blog performance, beehiiv, Plausible, or MonsterInsights are great options.
Meanwhile, if you want deeper insights into user behavior and don’t mind dealing with the extra complexity and cost, then Matomo, Kissmetrics, or Adobe Analytics might suit you better.
That said, beehiiv stands out as the top choice for creators, solopreneurs, and small business owners. It’s easy to set up and brings your blog, newsletter, and website analytics together in one place.

Best Website Analytics Tools: Frequently Asked Questions
How Do I Get Analytics for My Website?
Website builders like beehiiv and HubSpot include built-in analytics and integrate natively with Google Analytics and Google Search Console for deeper insights. If you’re using another platform, you’ll need to add its tracking code to your website to collect this data.
What Is the Most Popular Web Analytics Tool?
The most popular web analytics tool is Google Analytics because it’s free and offers detailed user insights. However, many users find it complex and prefer simpler tools like beehiiv Analytics, MonsterInsights, or Plausible.
Is There a Free Analytics Tool?
Yes, Google Analytics is a free analytics tool for websites. Plausible and Matomo also offer free open-source versions you can host yourself.
Related Articles


The one place to build.
Get beehiiv updates delivered directly to your inbox.
By subscribing you agree to our Privacy Policy and provide consent to receive updates from our company.